
Introduction
This project was my final presentation for my Data Mining and Machine Learning class at Elon University. My teammate on this project was Tamer Metwalli.
If you know anything about me, you probably know that I am a huge movie fanatic. I love watching movies, talking about movies, and reading about movies. I am actually continually working my way through the IDMB top 2015 movies list. I also love data science and machine learning. So, I decided to combine my two passions and create a machine learning model that predicts Rotten Tomatoes scores from movie reviews and basic information from the movie. The dataset I used for this project is here. For this project, we wanted to answer the question: Can we predict Rotten Tomatoes scores from movie reviews and basic information from the movie? To do this, we knew that we would need to use sentiment analysis and machine learning.
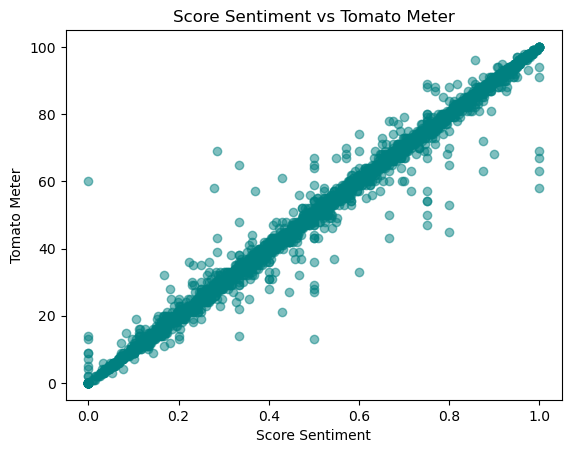
First we need to cover a little bit about what the TomatoMeter is and how it is calculated. From the Rotten Tomatoes website: “The Tomatometer score represents the percentage of professional critic reviews that are positive for a given film or television show.”
Below is a graph showing the relationship between the mean score sentiment provided by Rotten Tomatoes and the Rotten Tomatoes score. It is clear from this that Rotten Tomatoes is using score sentiment to calculate the TomatoMeter. However, it is not clear if score sentiment comes from Rotten Tomatoes’ own sentiment analysis or if the score sentiment is provided by the critic.
Data Cleaning
The first thing that we did was clean the data. As to be expected, there were a large number of null values in each column. Because the data set was so large, we dropped most of the rows which had null values. We had to encode out columns like genre, change the release date to a datetime, that kind of thing. We added some columns which we thought might have been useful to the machine learning process later on. For example, we added number of days till Christmas and Fourth of July, thinking that those two dates are generally when large movie releases happen.
Sentiment Analysis
If you are unfamiliar with sentiment analysis, what it essentially does is takes some text, and outputs some values indicating the sentiment of that text. Different models output different things. Some output a positive, neutral, and negative score from zero to 1. Some output a positive and negative score and a “intensity” score, etc. For this project, we used two pre trained sentiment analysis models. We could have used just one, but we were interested in the differences between the two models. The first model we used was the Vader which is trained on social media posts. What this means is that the model is going to be very good at recognizing informal things like emojis, text symbols like :) and :D, and shorter text in general. We thought this might be good as many of the movie reviews were very short and informal. The second model we used was TextBlob, specifically the Naive Bayes Analyzer, which had been trained on movie reviews, so we thought this would be perfect for our application. We will discuss the results of these models later. Because of the many-to-one relationship between movie reviews and movies, we needed to aggregate the sentiment scores for each movie. We did this by using statistics principles and getting the mean, median, 25%, 75%, and standard deviation of the sentiment scores for each movie. The idea behind this was to get the curve of the sentiment scores for each movie. In the end, we found that the mean value was the most useful.
Lets compare the two different sentiment analysis models. Below is a graph showing the relationship between the mean positive and negative sentiment vs. the TomatoMeter for each model.
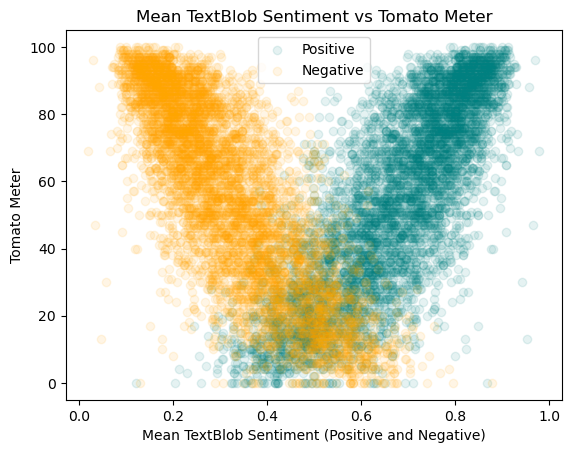
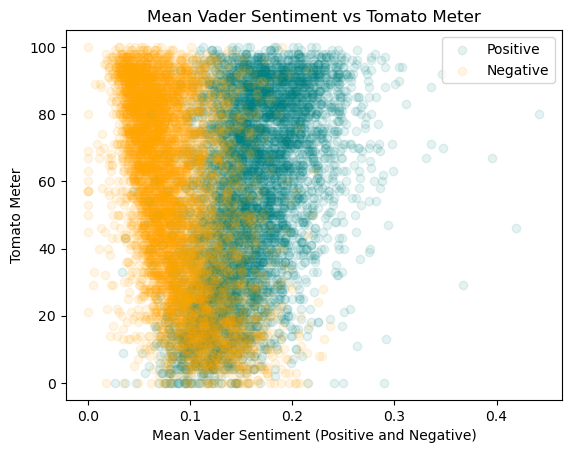
As we can see, TextBlob covers a much wider range of values from 0.2 to 0.6 for negative and from 0.4 to 1.0 for positive in comparison to Vader which only covers the range of 0 to 0.2. Also, TextBlob’s trend in general is much cleaner looking than Vader’s indicating that it is more accurate at predicting the TomatoMeter. This makes sense, as the TextBlob model we used was trained on movie data, while the Vader model was trained on social media data.
Data Visualization
One thing to note for these visualizations is that they are graphing movies that did not have missing values. What this means is that movies more likely to have missing values such as smaller indie films may not be represented in these graphs. This is a limitation of the dataset, as filling in missing values where so many are missing would create inaccurate results.
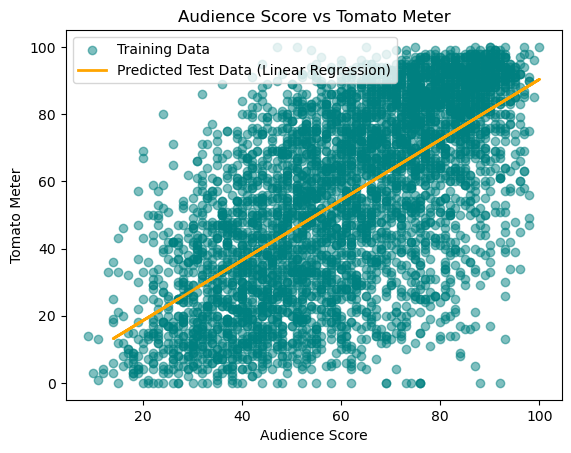
Here is the relationship between audience scores and the TomatoMeter. As you can see there are more movies where critics liked it and audiences didn’t than the other way around. This is interesting because it shows that critics and audiences don’t always agree on movies.
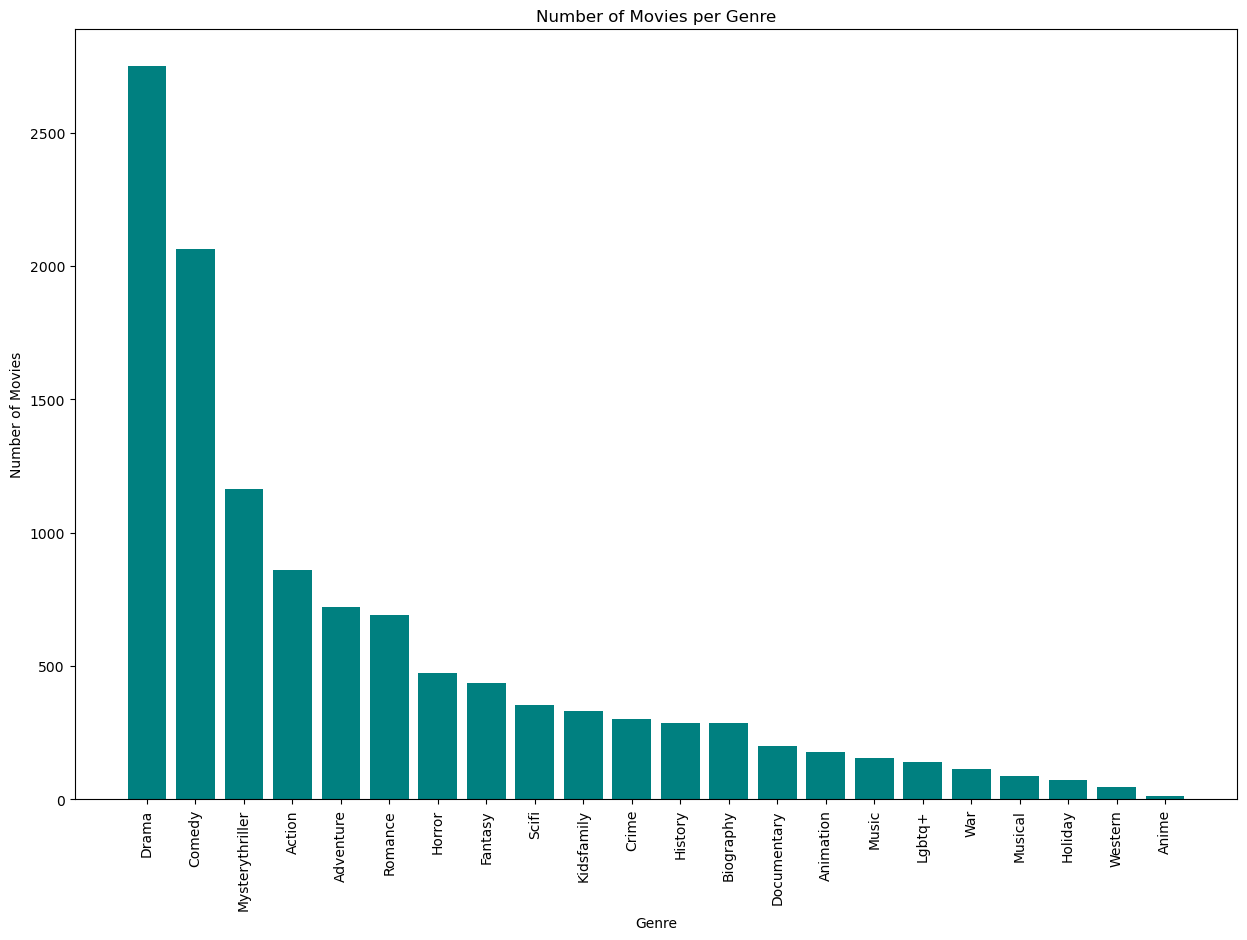
Here’s a quick look at the number of movies per genre. Keep in mind that movies can have multiple genres. As we can see, Drama and Comedy are the most popular genres by far, followed by mystery thrillers and action movies. This makes sense as these are the most popular genres in general for new movies. We also see that the least common genres are anime, western, and holiday movies.
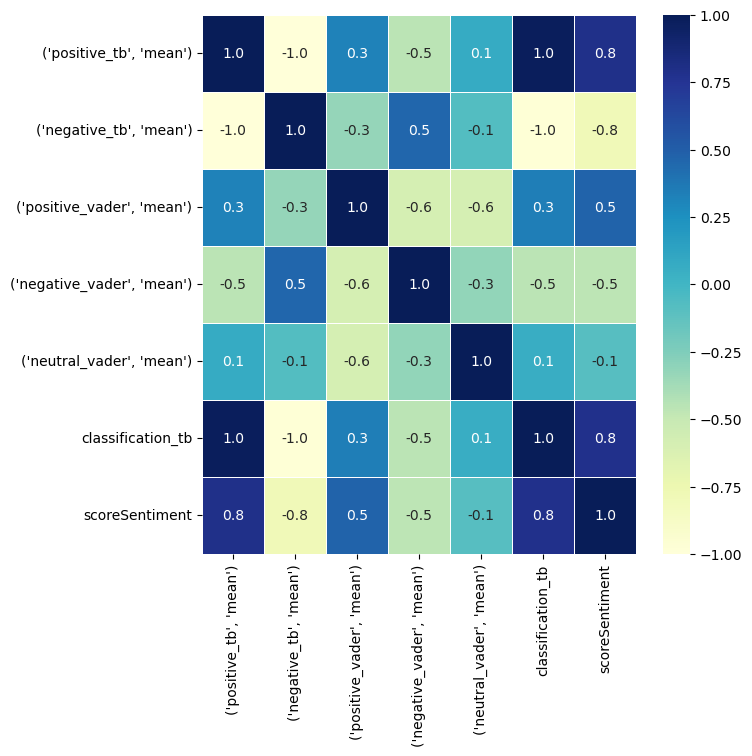
Taking a quick look at the correlation matrix looking at the relationship between Rotten Tomatoes’ score sentiment, TextBlobs, and Vaders. We can see that TextBlob and Vader are very highly correlated, which makes sense as they are both sentiment analysis models. We can also see that TextBlob and Vader are both highly correlated with Rotten Tomatoes’ score sentiment, which means that they are both good at predicting the TomatoMeter. The most interesting thing to note here is the bottom row of numbers in the matrix, looking at the relationship between score sentiment and the results from TextBlob and Vader, showing that TextBlob does has a higher correlation with the TomatoMeter than Vader. (0.5 vs 0.8)
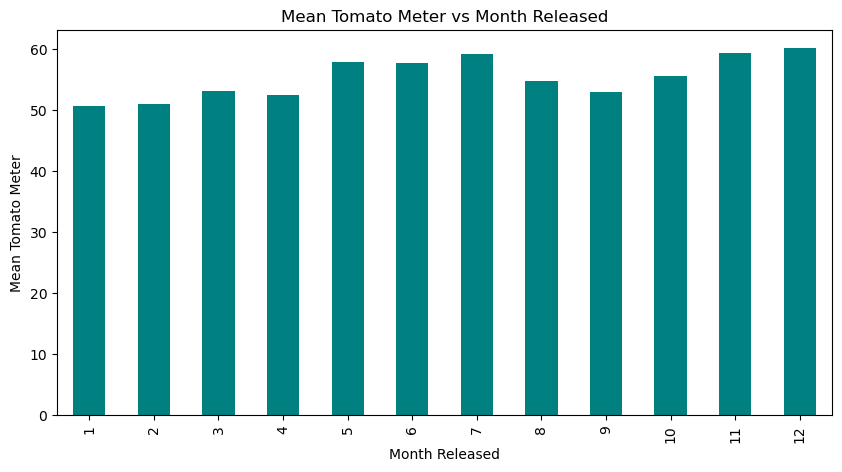
Here we see the mean TomatoMeter score for each month of releases. I did not think that I would see such a large difference between the months, but it makes sense that the summer months would have higher scores as that is when the big blockbuster movies are released, as well as November and December for the Holiday releases. It is also interesting to note that the lowest scoring month is January, which is when the worst movies are released.
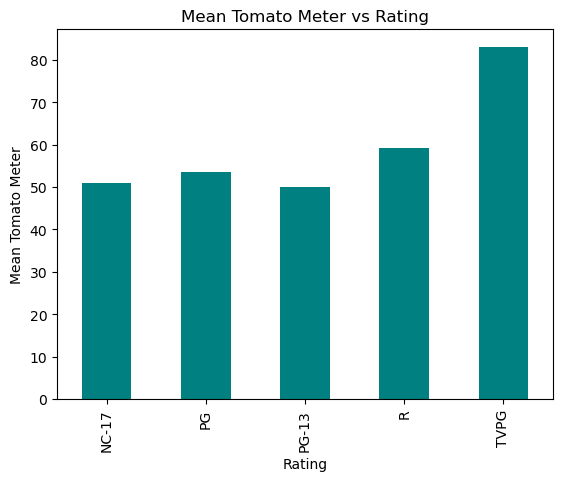
Here looking at the relationship between a movie’s rating (PG, PG-13, R, etc.) and the TomatoMeter. We can see a major outlier in this result that is TVPG. I suspect this may be the result of a few movies released with that rating that happen to have a very high TomatoMeter score. Taking a look at other ratings, we can see that R is the highest, with PG-13 being the lowest. This may be because there are more adult focused movies such as The Shawshank Redemption and The Godfather that are rated R, while PG-13 movies are more likely to be targeted towards children and teenagers.
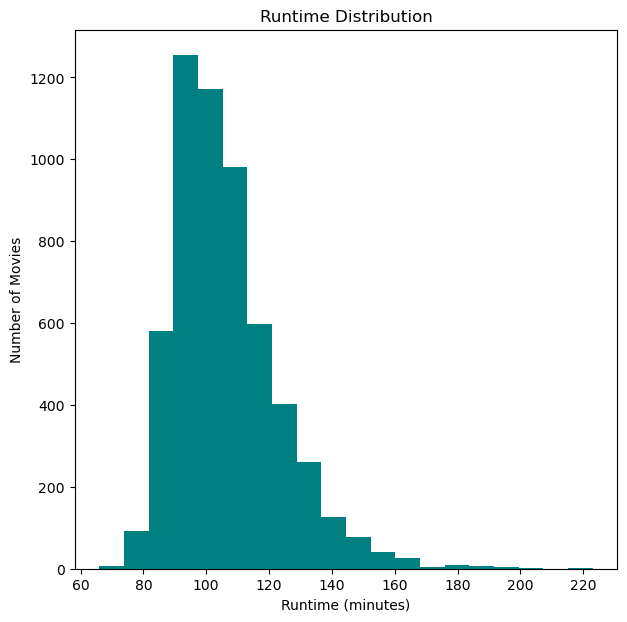
Looking at the runtime, nothing to unexpected here, most movies floating around the 100 minute mark, with very few below 70 minutes. There are quite a few higher than 100 minutes, but around 130 minutes seems to be the drop off point of movies with longer runtimes.
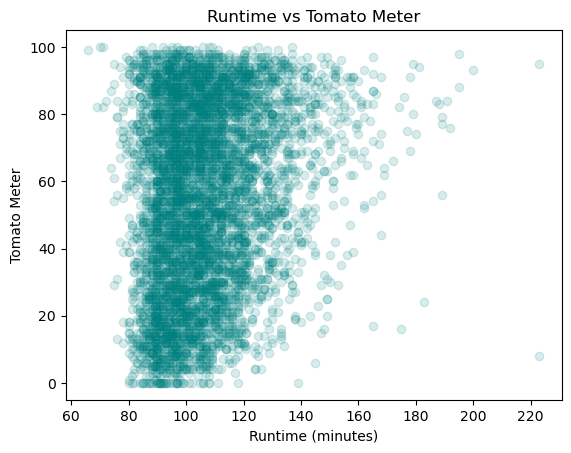
Looking at the relationship between runtime and the TomatoMeter, we see that there is not to strong of a correlation here, but we do see that there tend to be more higher runtime movies with higher TomatoMeter scores. This makes sense as longer movies tend to be more serious and have more time to develop characters and plot, which is what critics tend to like, but the relationship is not too strong.
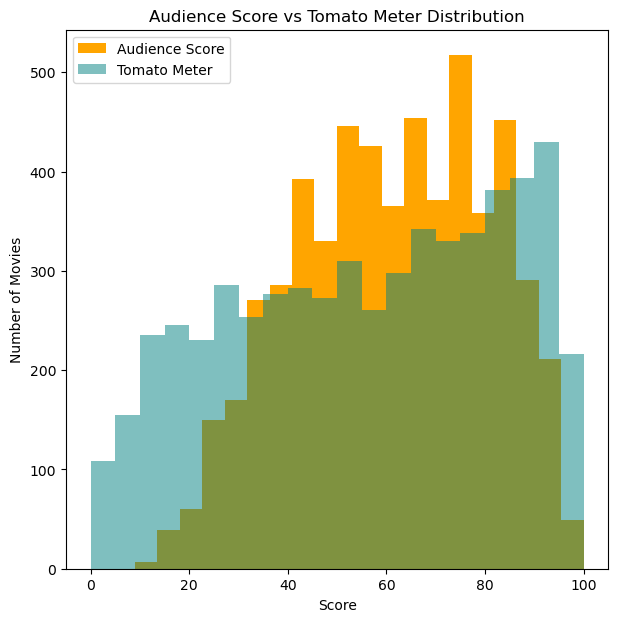
Looking at the differences in the distribution of audience scores and the TomatoMeter, we can see that the TomatoMeter is a much more linear line in comparison to audience score which looks like a bell curve. Also, audience score has some peaks, most likely round numbers such as 50, 60, 70, etc. This is most likely because people are more likely to give a movie a round number score than a more specific score like 57.
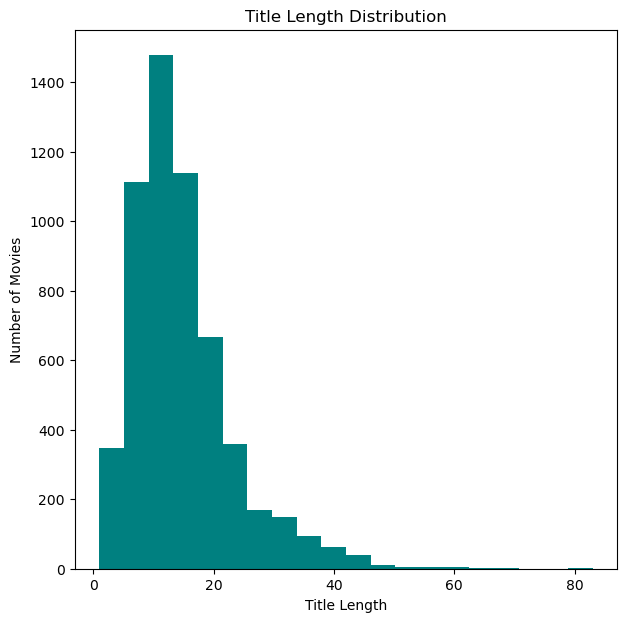
The last graph I wanted to look at in this section is kind of fun, the distribution of title length. As we can see, there is definitely a peak around 10 characters. This is kind of an interesting insight into psychology, as people are more likely to remember things that are shorter and easier to say. This is why we see so many movies with short titles such as Jaws, Alien, and Psycho.
Machine Learning
The goal for this was to be able to accurately predict the TomatoMeter score of a movie based on the features we have. I used a few different models to do this, and the best ended up being XGBoost. We ended up with around a 8.6 Mean Absolute Error, which is not too bad considering the TomatoMeter is on a scale of 0 to 100. What this means is that on average, the model is off by 8.6 points. This is not too bad considering the fact that the TomatoMeter is based on the opinions of hundreds of critics, and we are trying to predict it based on a few features.
Conclusion
Overall, I think this was a very interesting project. I learned a lot about sentiment analysis, it’s uses and the performance differences between models trained on different things. We also covered some very interesting trends in the film and critic industry as a whole. The machine learning portion of the project I consider to be a massive success, as we saw performance much higher than I anticipated. If you would like to see the code for this project or the data after cleaning, you can contact me here.