Intro
One of my favorite video game franchises that I have been following for years is the Forza Horizon series. If you are unfamiiar, it is a sandbox type racing games where you pick from a massive selection of cars and race them against other players or AI. That is what you are ‘supposed’ to do in the game. What I tend to do is cruise around and explore the world in any random car, while typically doing something else, whether it’s watching videos, tv shows, or movies, or just taking with friends online. It’s one of, if not the best find for me to take a break from work, and focus on nothing. This project is one that I’ve had in my brain for a long time, but only recently have I had to the time to get done. I knew the data collection portion of hits would be challenging, if I wanted to get every piece of information for each car from the video game
Data Collection
This was one of the most challenging parts of the project, because there is no easy to way to get data out of the video game. You can’t just export the car list as a csv with all the stats or anything like that. I could have scraped the data from any of the various wikipedia sites for the game, but I found all of them to be insufficient in that they either held incomplete or incorrect data. I decided that the path to go down was to collect the data myself, directly from the game using computer vision (something I had never done before) so I could be sure that the data I had would be complete and accurate.
What I ended up doing was going through every car in the menu of the game one at a time, taking a screenshot twice for each car (main page and details page), cropping down each part of the screenshot, and using the Python package Pytesseract to analyze the images and come up with what text was in the images.
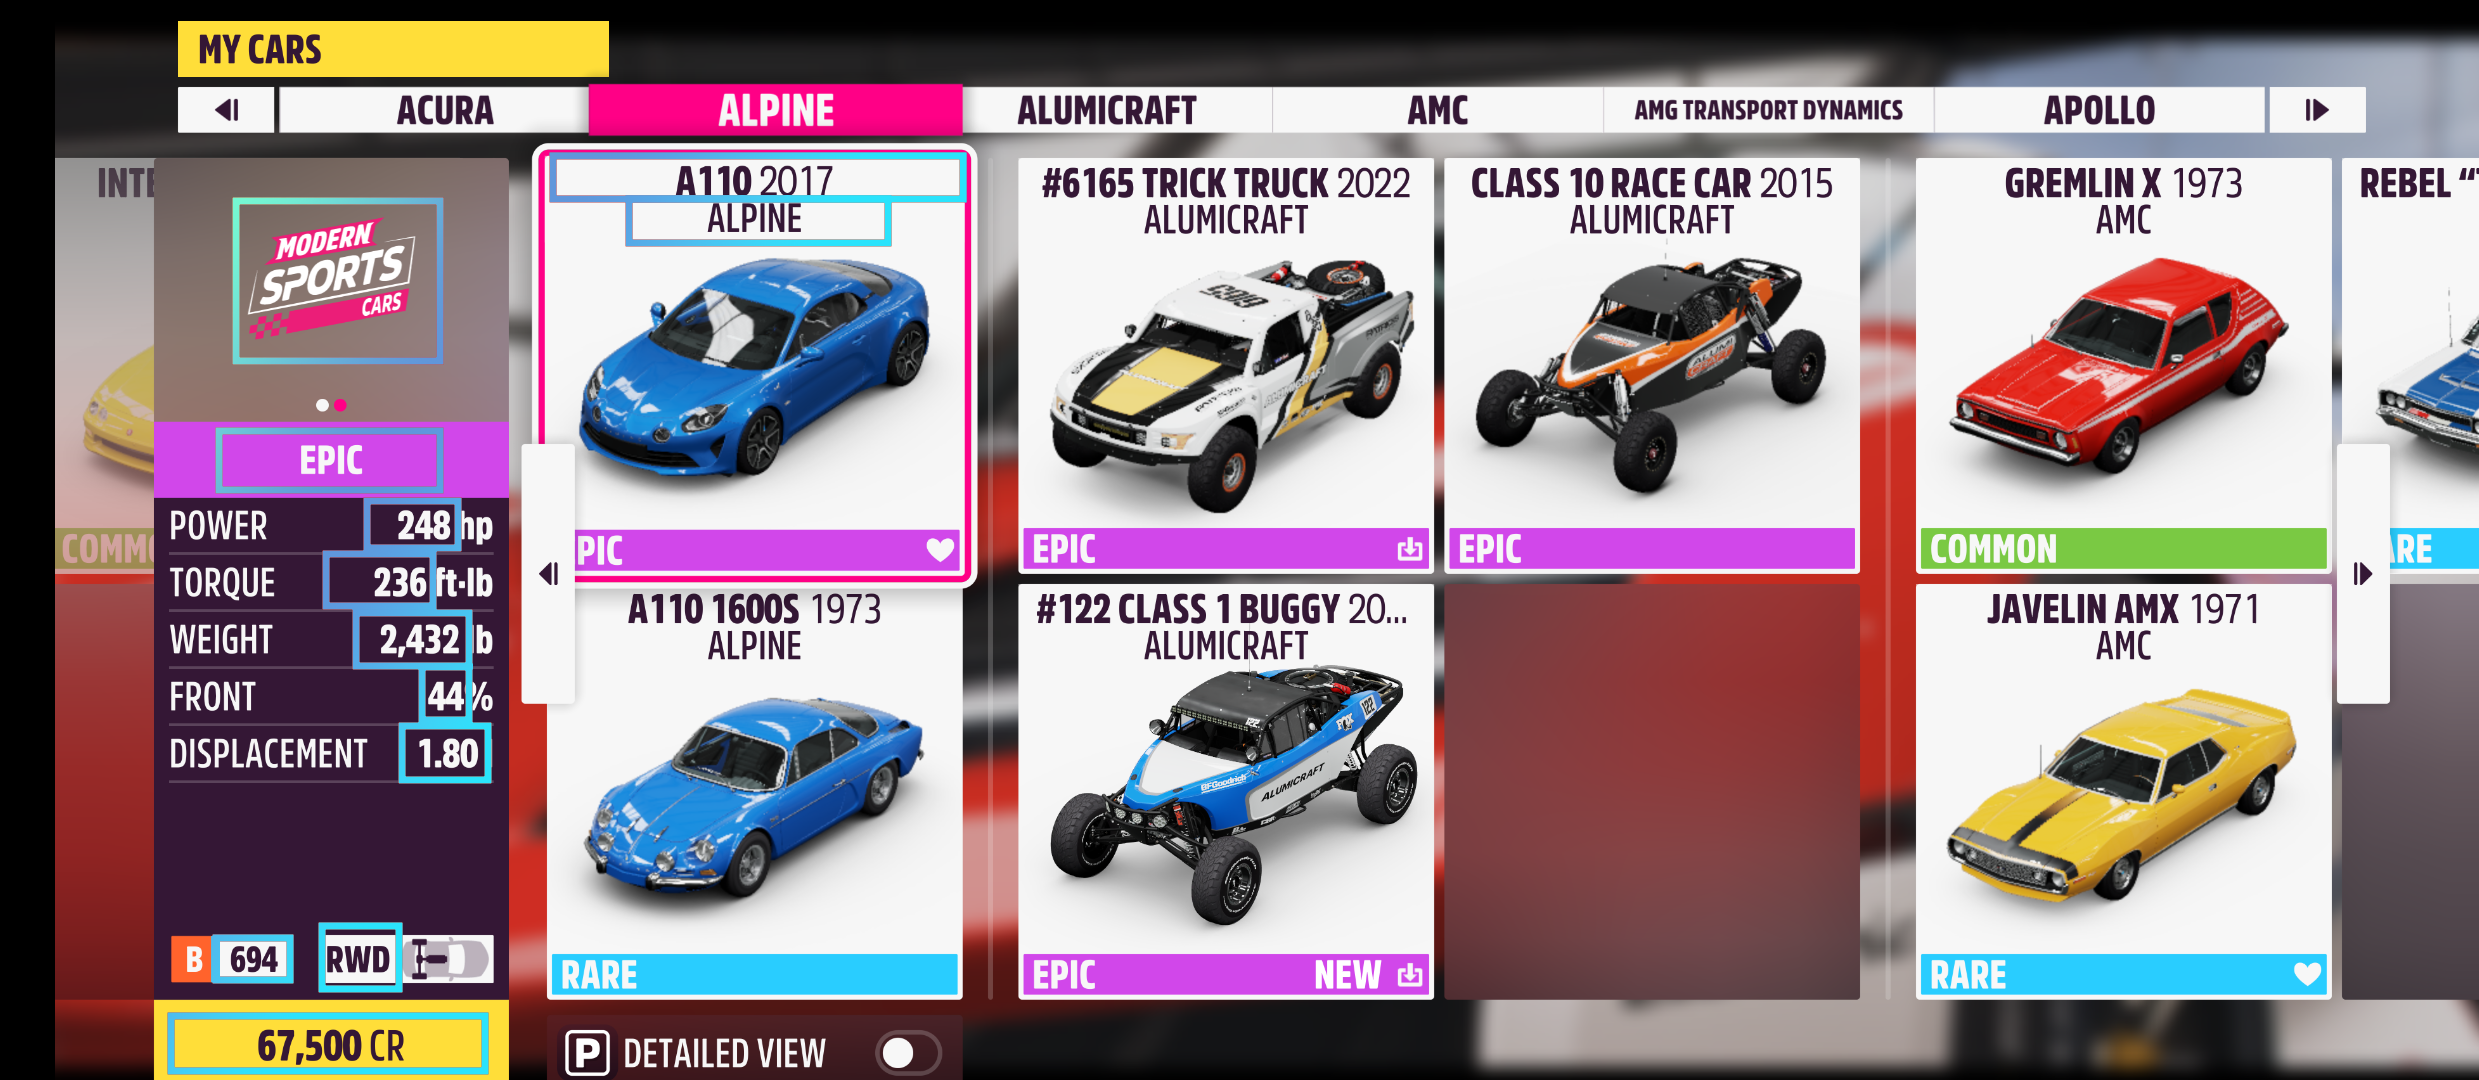
Here’s a screenshot of one of the two pages, with highlights around the cropped sections of image, each of which was fed into Pytesseract to extract the word or numbers
I also automated the process of moving through the the menu inside of the game, using the screenshots to identify if I needed to move right, down, or up to get the next car. I used the Python package PyAutoGui to take screenshots as well as to automatically press the keys. The total time time it took to get through every car automatically ended up being somewhere around an hour.
After collecting the data, it did require some cleaning, places where the computer misidentified a number or did not find a number at all. It took some time to double check every number, but it a million times faster than if I had to fill out all of the information individually.
Here is what the resulting data looked like.
| Year | Manufacturer | Name | Country | Speed | Handling | Acceleration | Launch | Braking | Offroad | Power | Torque | Weight | Front | Displacement | Drive wheels | Rarity | Car type | Cost | Performance index |
|---|---|---|---|---|---|---|---|---|---|---|---|---|---|---|---|---|---|---|---|
| 2018 | Chevrolet | Camaro ZL1 1LE | United States | 6.9 | 7.0 | 5.8 | 5.2 | 6.0 | 5.0 | 650.0 | 650 | 3837 | 54 | 6.16 | rwd | rare | track toys | 105000 | 824 |
| 1970 | Porsche | 914/6 | Germany | 4.4 | 3.9 | 3.4 | 2.8 | 2.5 | 5.4 | 125.0 | 131 | 2196 | 46 | 1.99 | rwd | rare | classic sports cars | 24000 | 427 |
| 2019 | Brabham | BT62 | Australia | 7.3 | 9.5 | 8.2 | 8.9 | 10.0 | 5.0 | 700.0 | 492 | 2349 | 41 | 5.39 | rwd | legendary | extreme track toys | 1500000 | 974 |
| 1997 | Land Rover | Defender 90 | United Kingdom | 3.8 | 3.0 | 2.7 | 1.8 | 2.5 | 8.4 | 182.0 | 232 | 3902 | 52 | 3.95 | awd | common | pickups & 4x4s | 30000 | 366 |
| 2016 | Cadillac | ATS-V | United States | 7.0 | 5.0 | 5.2 | 3.4 | 4.2 | 5.6 | 464.0 | 444 | 3700 | 51 | 3.56 | rwd | common | modern muscle | 65000 | 716 |
I also ended up merging my dataset with one I found online to include the origins for each car, as not every one can be bought from the store, others need to be won as rewards.
Result Visualizations
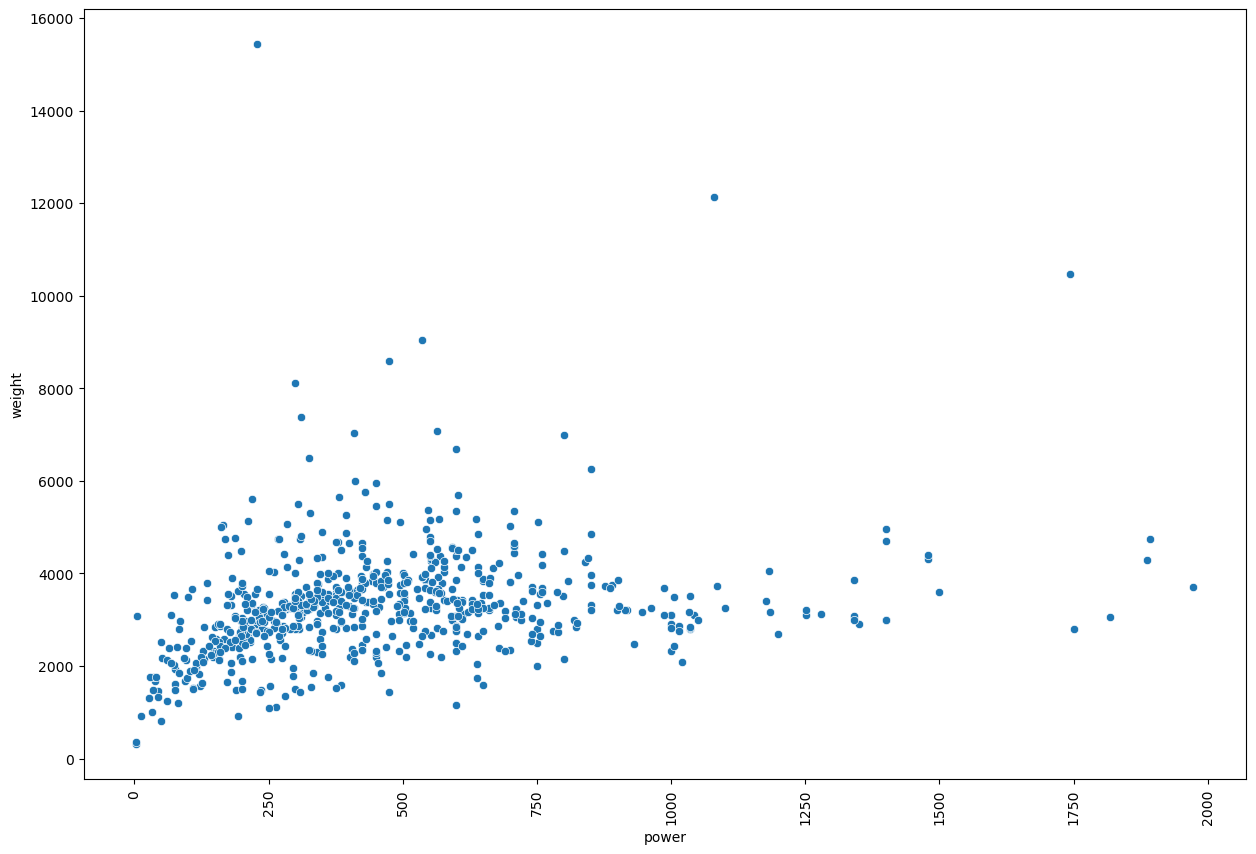
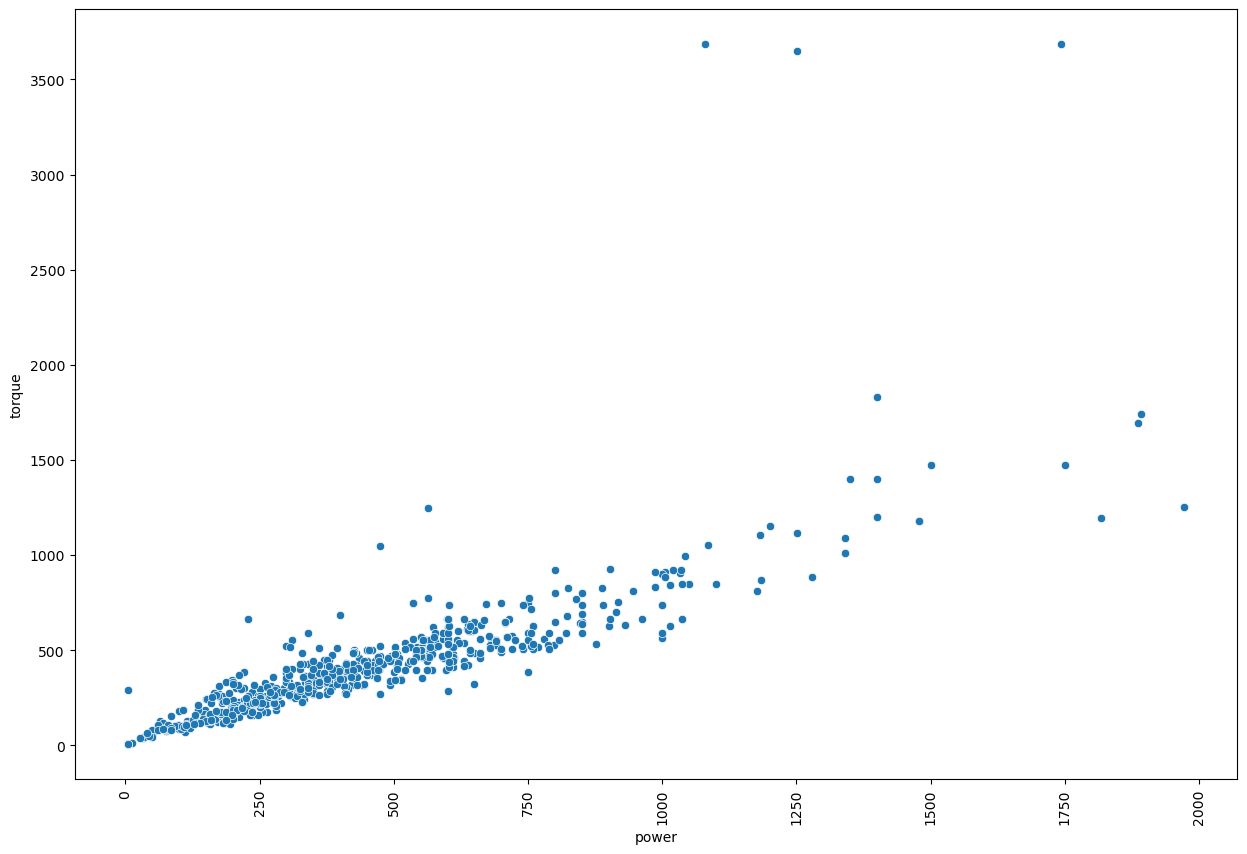
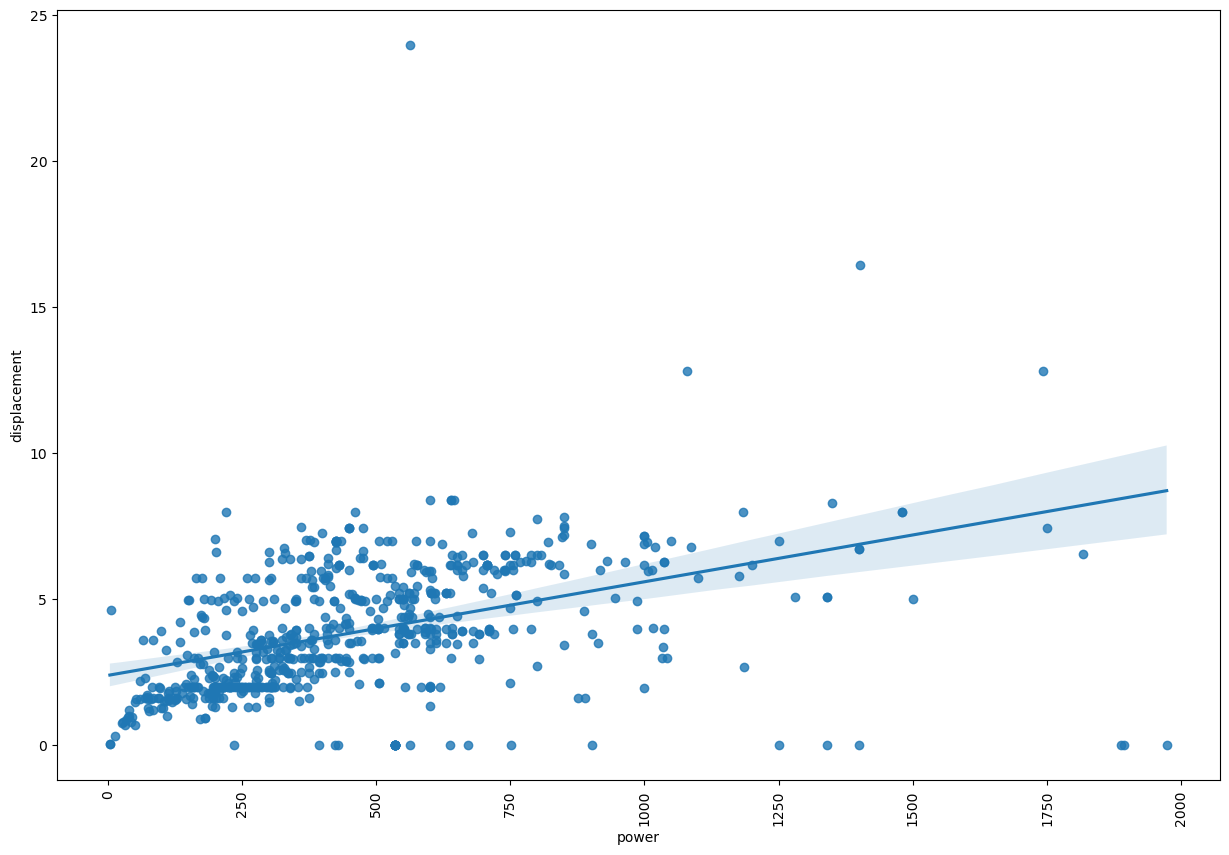
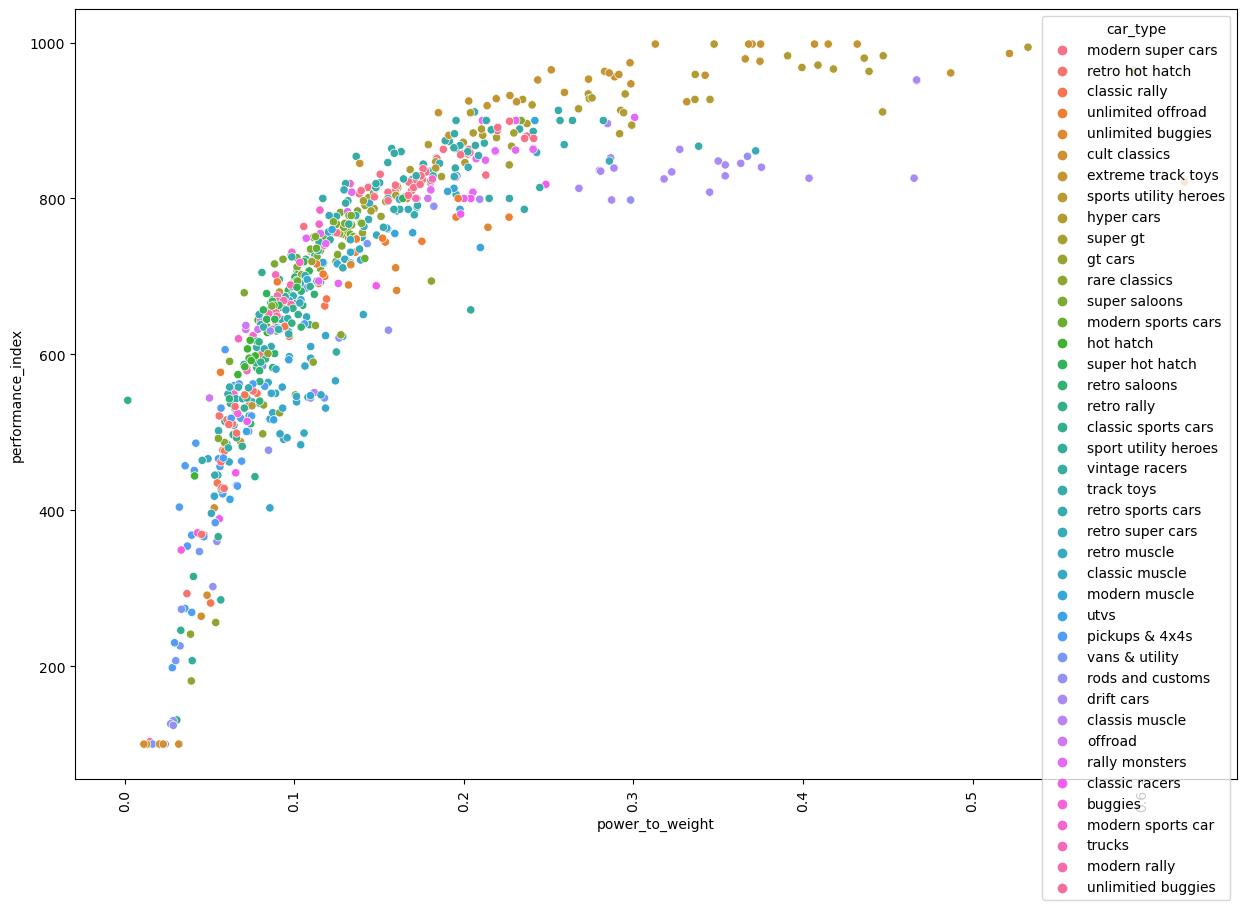
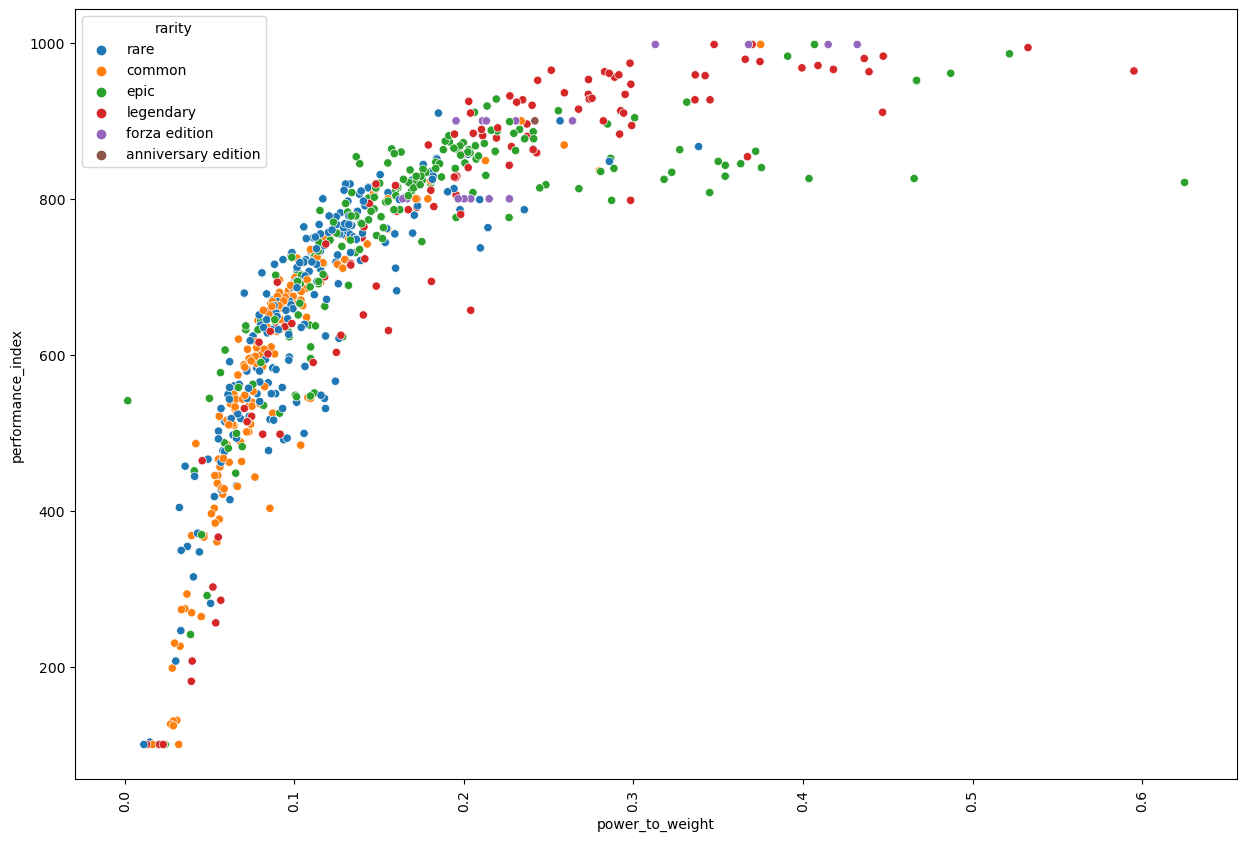
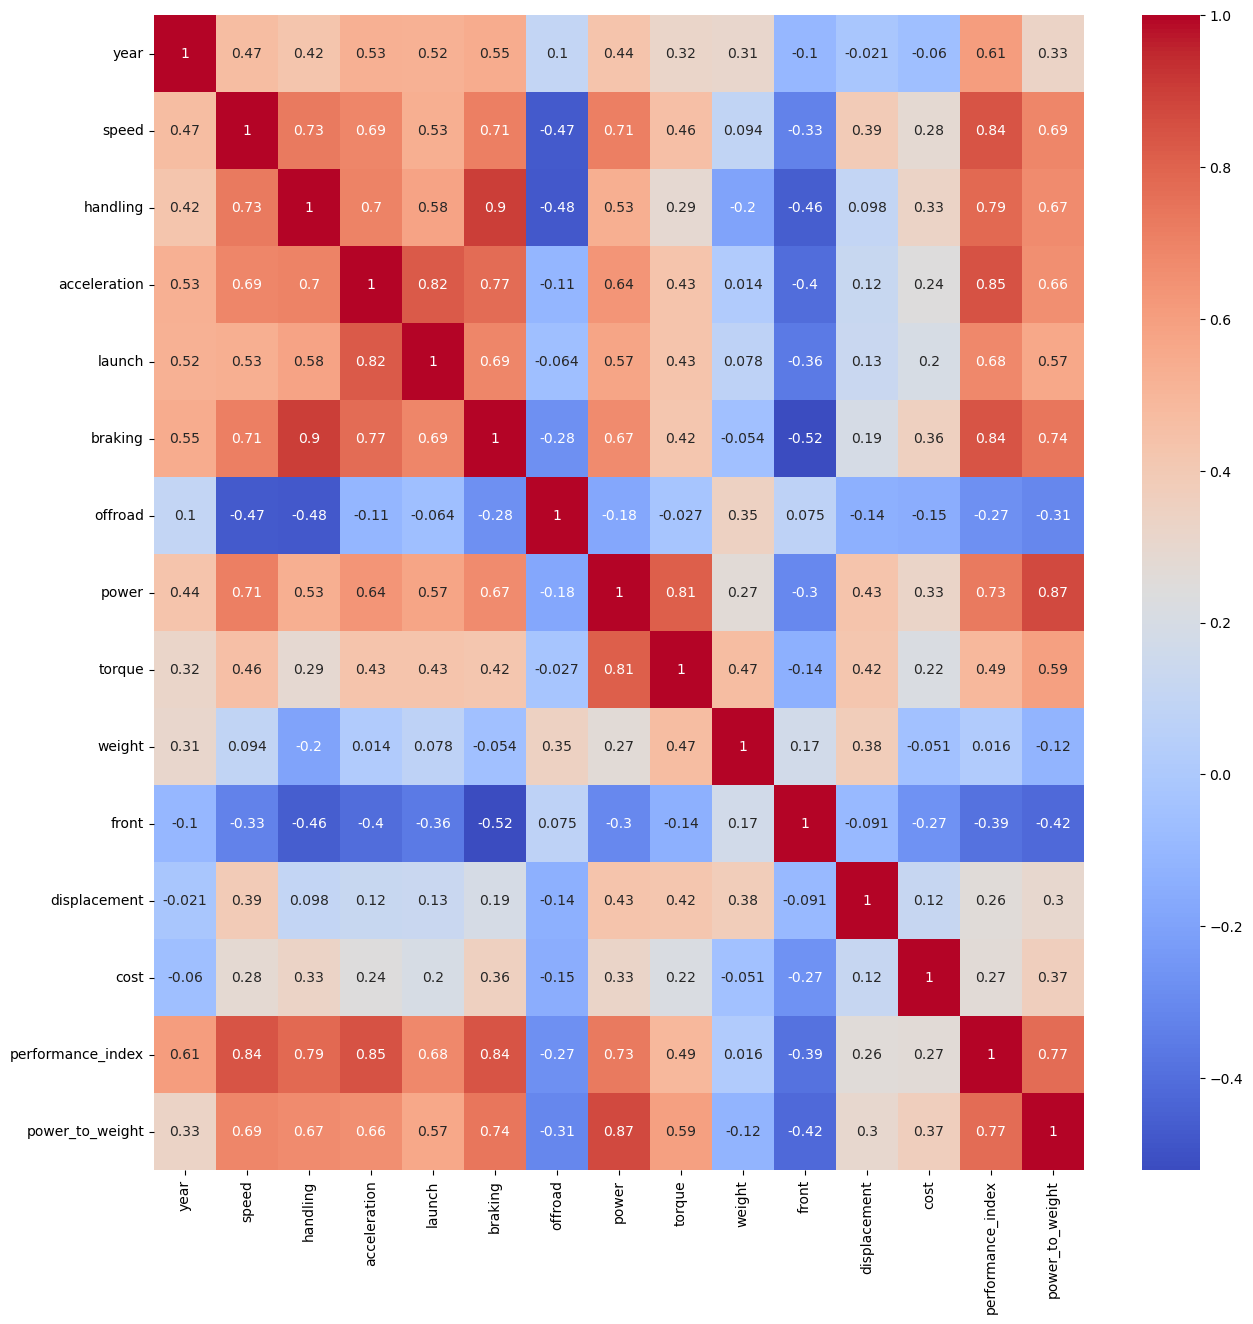
Here are some pretty interesting visualizations to look through from the data. Graphs were made using Seaborn and MatPlotLib
Result Analysis
Theres some pretty interesting relationships here, many of them are to be expected, but some are more surprising
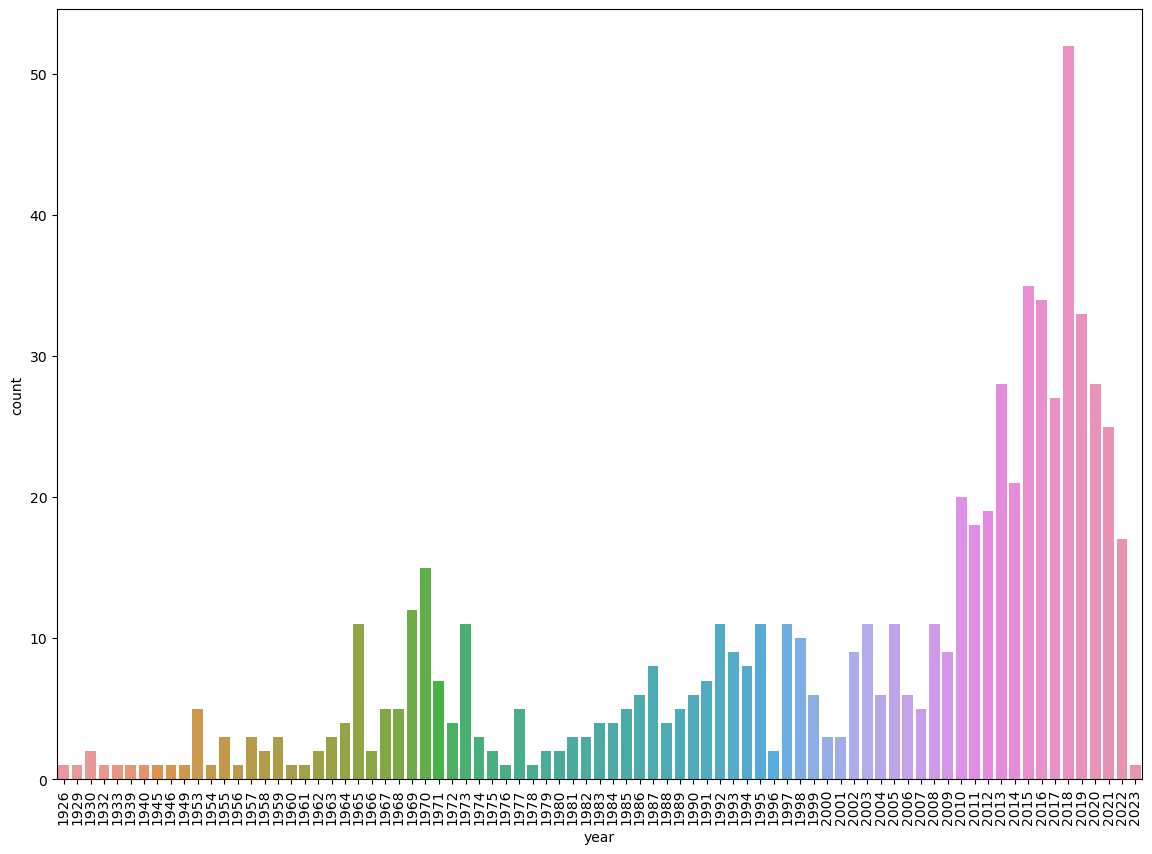
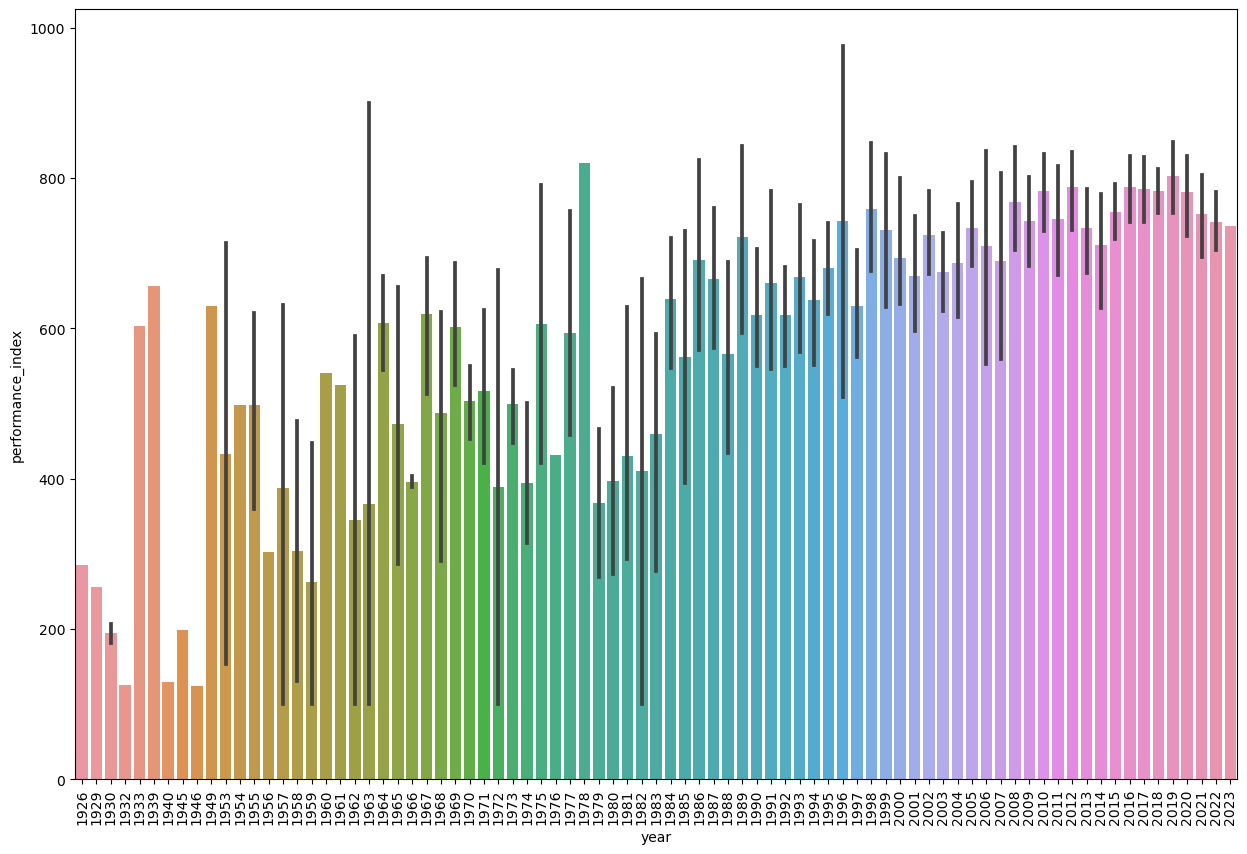
Looking at the number of cars per year, we see a large spike from 2011 to around 2022. Looking some context of the history of the series, we can see that the first game of the series Forza Horizon 1 originally released on 2012. This makes sense then that most cars are from the time period that the series has been ongoing, as players want to see the newest cars added. We can also see a sharp drop off for the year 2023. This makes sense as, from my understanding, creating the models and working with the manufactures to get the cars into the game is a process that takes a very long time. I expect that in the future as the game series continues and more cars are added, that the number from 2023 (and even 2024) will increase. Another trend is the spike in the late 60’s and early 70’s which can most likely be constituted to be from the peak of that muscle car era where manufacturers like Dodge, Chevrolet, and Ford released cars like the Mustang and teh Charger that are still iconic today. We also see a dip from the mid 70’s to the mid 80’s, a time period known as the Malaise Era for cars where the United States government released mandates to reduce pollution and increase fuel economy which killed the muscle cars of the late 60’s as manufacturers stumbled to adapt their designs to the new restrictions, ending the muscle car era. This dip can also be seen in the Performance Index vs. Year graph. We see another increase in the 90’s and 2000’s, a time when the Japanese economy was doing exceptionally well, and Japanese cars had gained a reputation of being cool and sporty with lots of technological innovations and intense competition between Japanese manufacturers like Toyota, Subaru, Mitsubishi, and Nissan. Many of the cars released in the era like the Toyota Supra sell in today’s market for more than fix figures as car enthusiasts look back at that era as a prosperous time for sports cars.
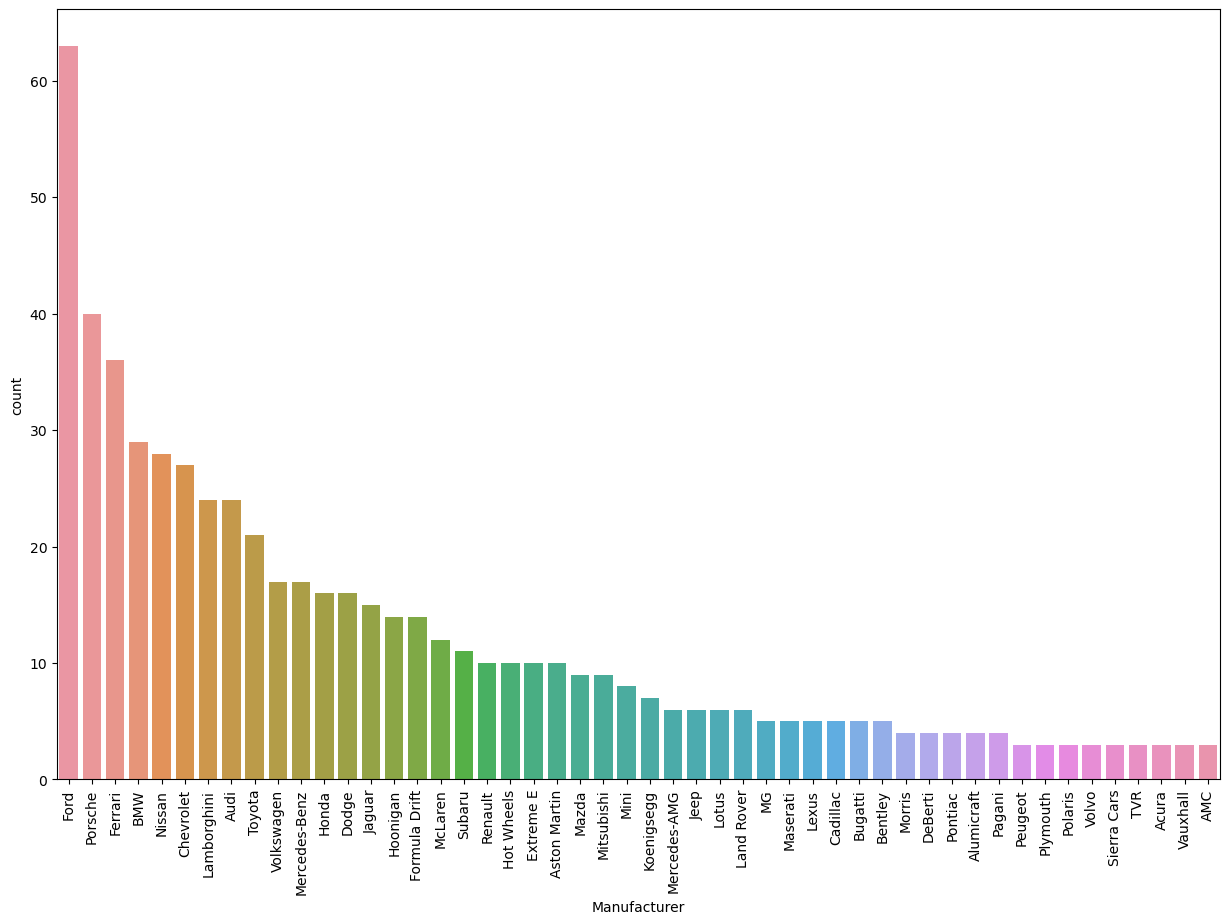
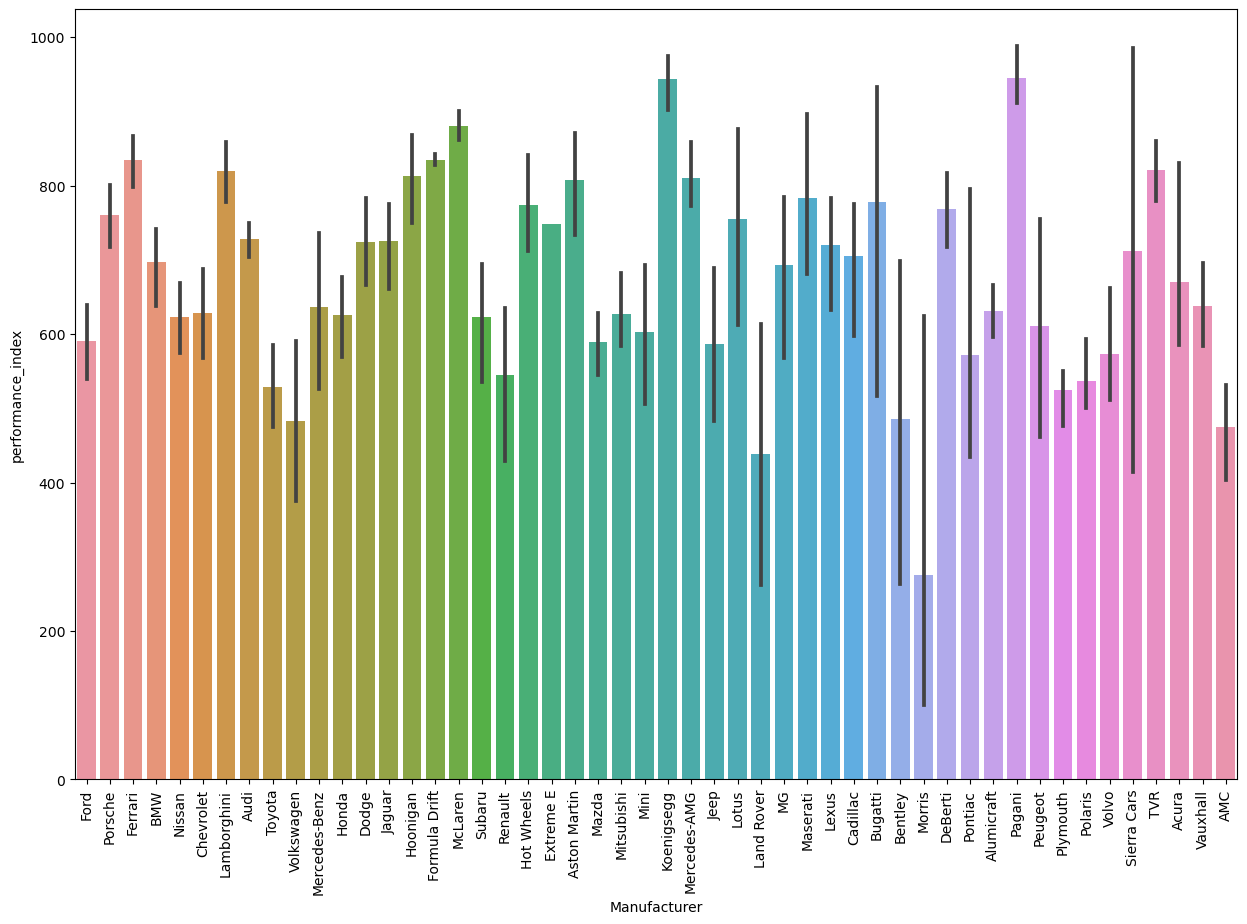
Looking at the number of cars per manufacturer, we see that the top brands have been around for a long time and had a history of racing and sports cars. Also, the brands at the top of the chart tend to release more cars in general. The top 5 in order are Ford, Posrche, Ferarri, BMW, and Nissan. One interesting thing is that Ford is significantly higher than the 2nd manufacturer, which can be explained by their history in racing, the number of cars they release with different divisions all over the world, how popular they are among car enthusiasts, and the inclusion of multiple generations of certain cars like the Mustang.
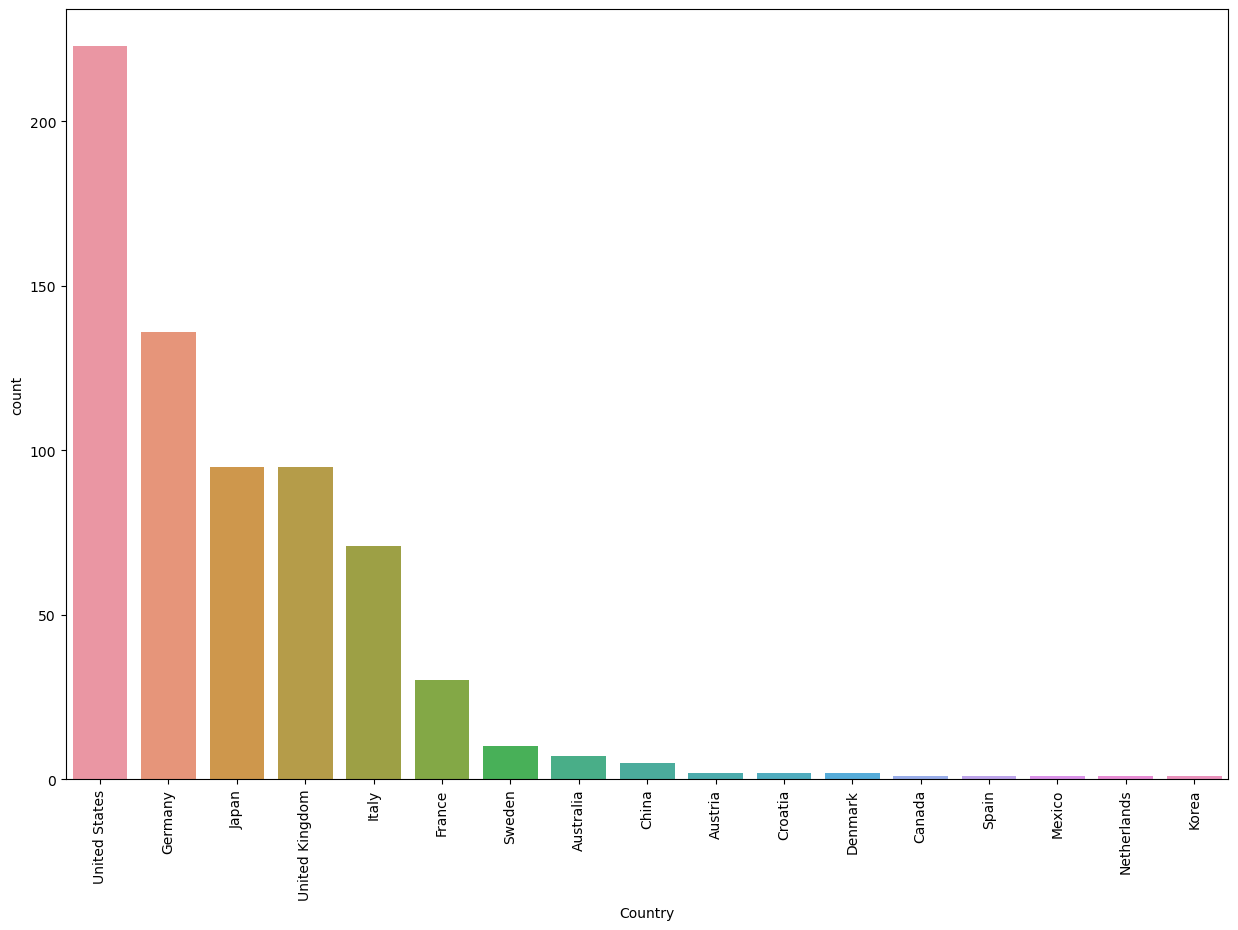
Number of cars per country shows nothing too surprising as the United States, Germany, Japan, and the United Kingdom are generally seen as the countries that manufactures are based in
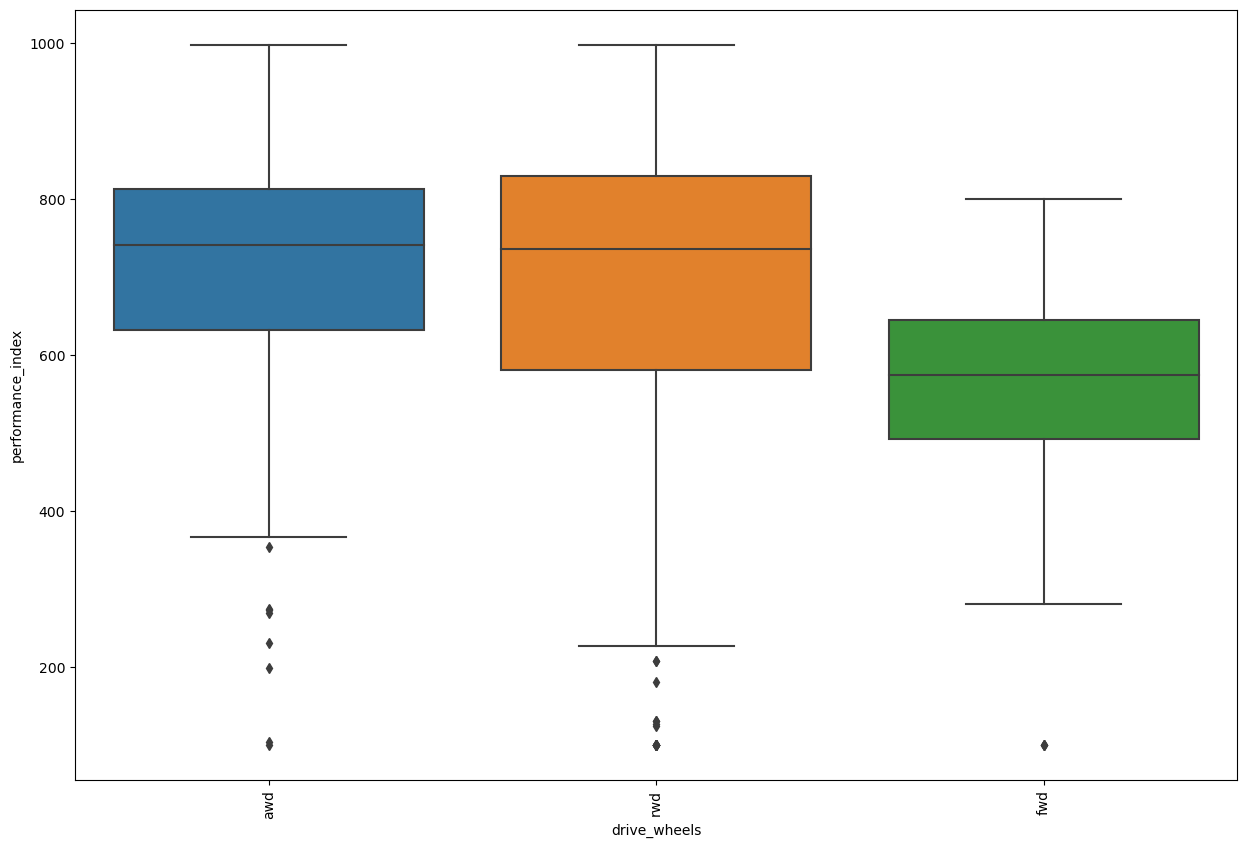
The last graph I will highlight is the boxplot looking at the relationship between drive wheels and performance index. To be expected, front where drive is lowest, which make sense as front wheel drive cars are generally built on a set budget by manufacturers and have more limitations with the amount of power that they can handle because of various physics and chassis dynamics reasons I won’t go into here. Interestingly, we see all wheel drive and rear wheel drive have a very similar box plot, with them both having a near identical median value. However, we can see that there are more cars with a lower performance index that are rear wheel drive in comparison to all wheel drive. This makes sense as all wheel drive cars are generally more expensive and are more commonly found in higher end sports cars and super cars. However, both rear wheel drive and front wheel drive are seen as having a high 75%, with rear wheel drive being slightly higher.
Conclusion
Overall, I think this was a pretty interesting dataset to work with. There were more interesting observations than I was expecting, as the Forza Horizon 5 car list is not a complete list of all cars released, and is biased in that it focuses more on sporty cars. If you are interested in using the dataset, you can email me using the email here. I will most likely not be releasing the dataset publicly, but if I get enough interest I certainly will. I hope you enjoyed reading this as much as I enjoyed making it!